How to Calculate Data Center Power Consumption (PUE, IT Load & AI Server Power Explained)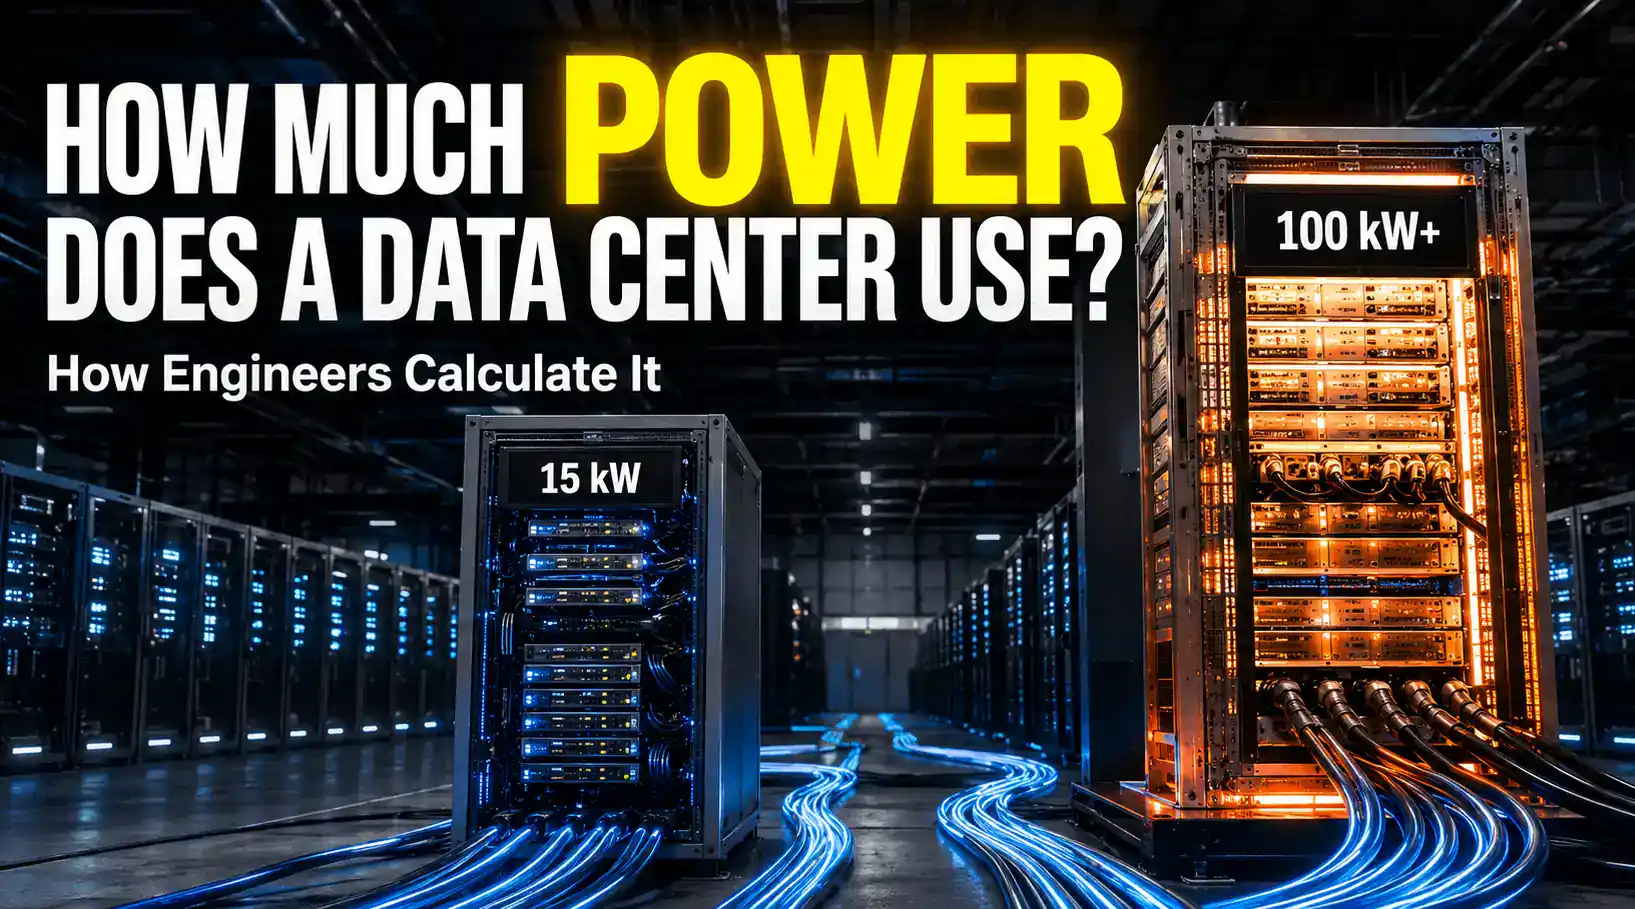
Quick answer:
Engineers calculate data center power in two main steps. First, they figure out how much electricity the computers themselves actually use, called the IT load. Then they multiply that number by PUE (Power Usage Effectiveness), which covers the extra power needed for cooling and other building needs. A PUE of 1.4 means the building pulls 1.4 watts from the power grid for every 1 watt that actually reaches the computers.
AI computer rooms break this simple math, though: a rack full of AI chips can use 30 to 100+ kW, while a normal server rack only uses 5 to 15 kW. That’s why today’s engineers also lean on chip-level power data, computer models called digital twins, and heat simulations to get a solid estimate before anything actually gets built.
Why Data Center Power Estimation Matters More Than Ever
Every text you send, video you watch, or question you ask an AI gets handled by a data center somewhere. These buildings never stop. They run all day, every day, all year.
Around the world, data centers used about 415 terawatt-hours of electricity in 2024, says the International Energy Agency. That is roughly 1.5% of all the electricity used on Earth.
That number has been growing fast, about 12% a year. The IEA thinks it could grow past 945 TWh by 2030, and by 2035, it could be close to 1,200 TWh.
In the United States, the Department of Energy’s Lawrence Berkeley National Laboratory found that data centers used 4.4% of all US electricity in 2023. They think that could rise to somewhere between 6.7% and 12% by 2028.
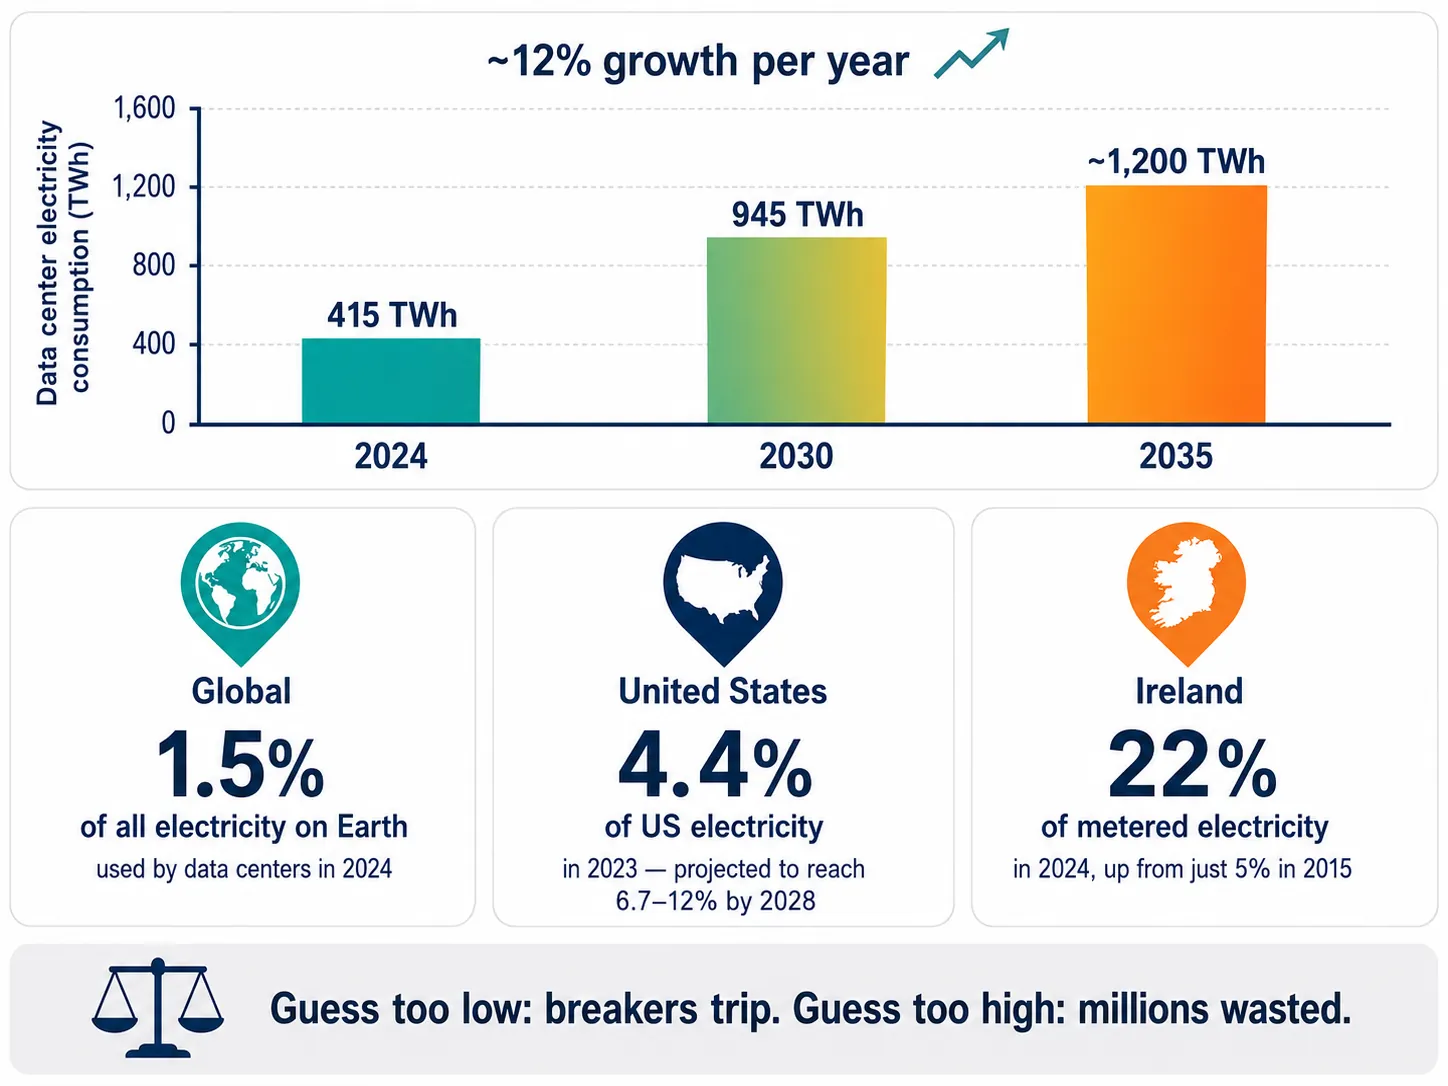
Some countries feel this even more. In Ireland, data centers used 22% of all metered electricity in 2024. Back in 2015, that number was only 5%.
This is why getting the power estimate right really matters. Guess too low, and breakers trip and servers overheat. Guess too high, and a company spends millions of dollars on equipment that just sits there doing nothing. Engineers have to get this number right before a single server gets installed.
Where Does Data Center Electricity Go?
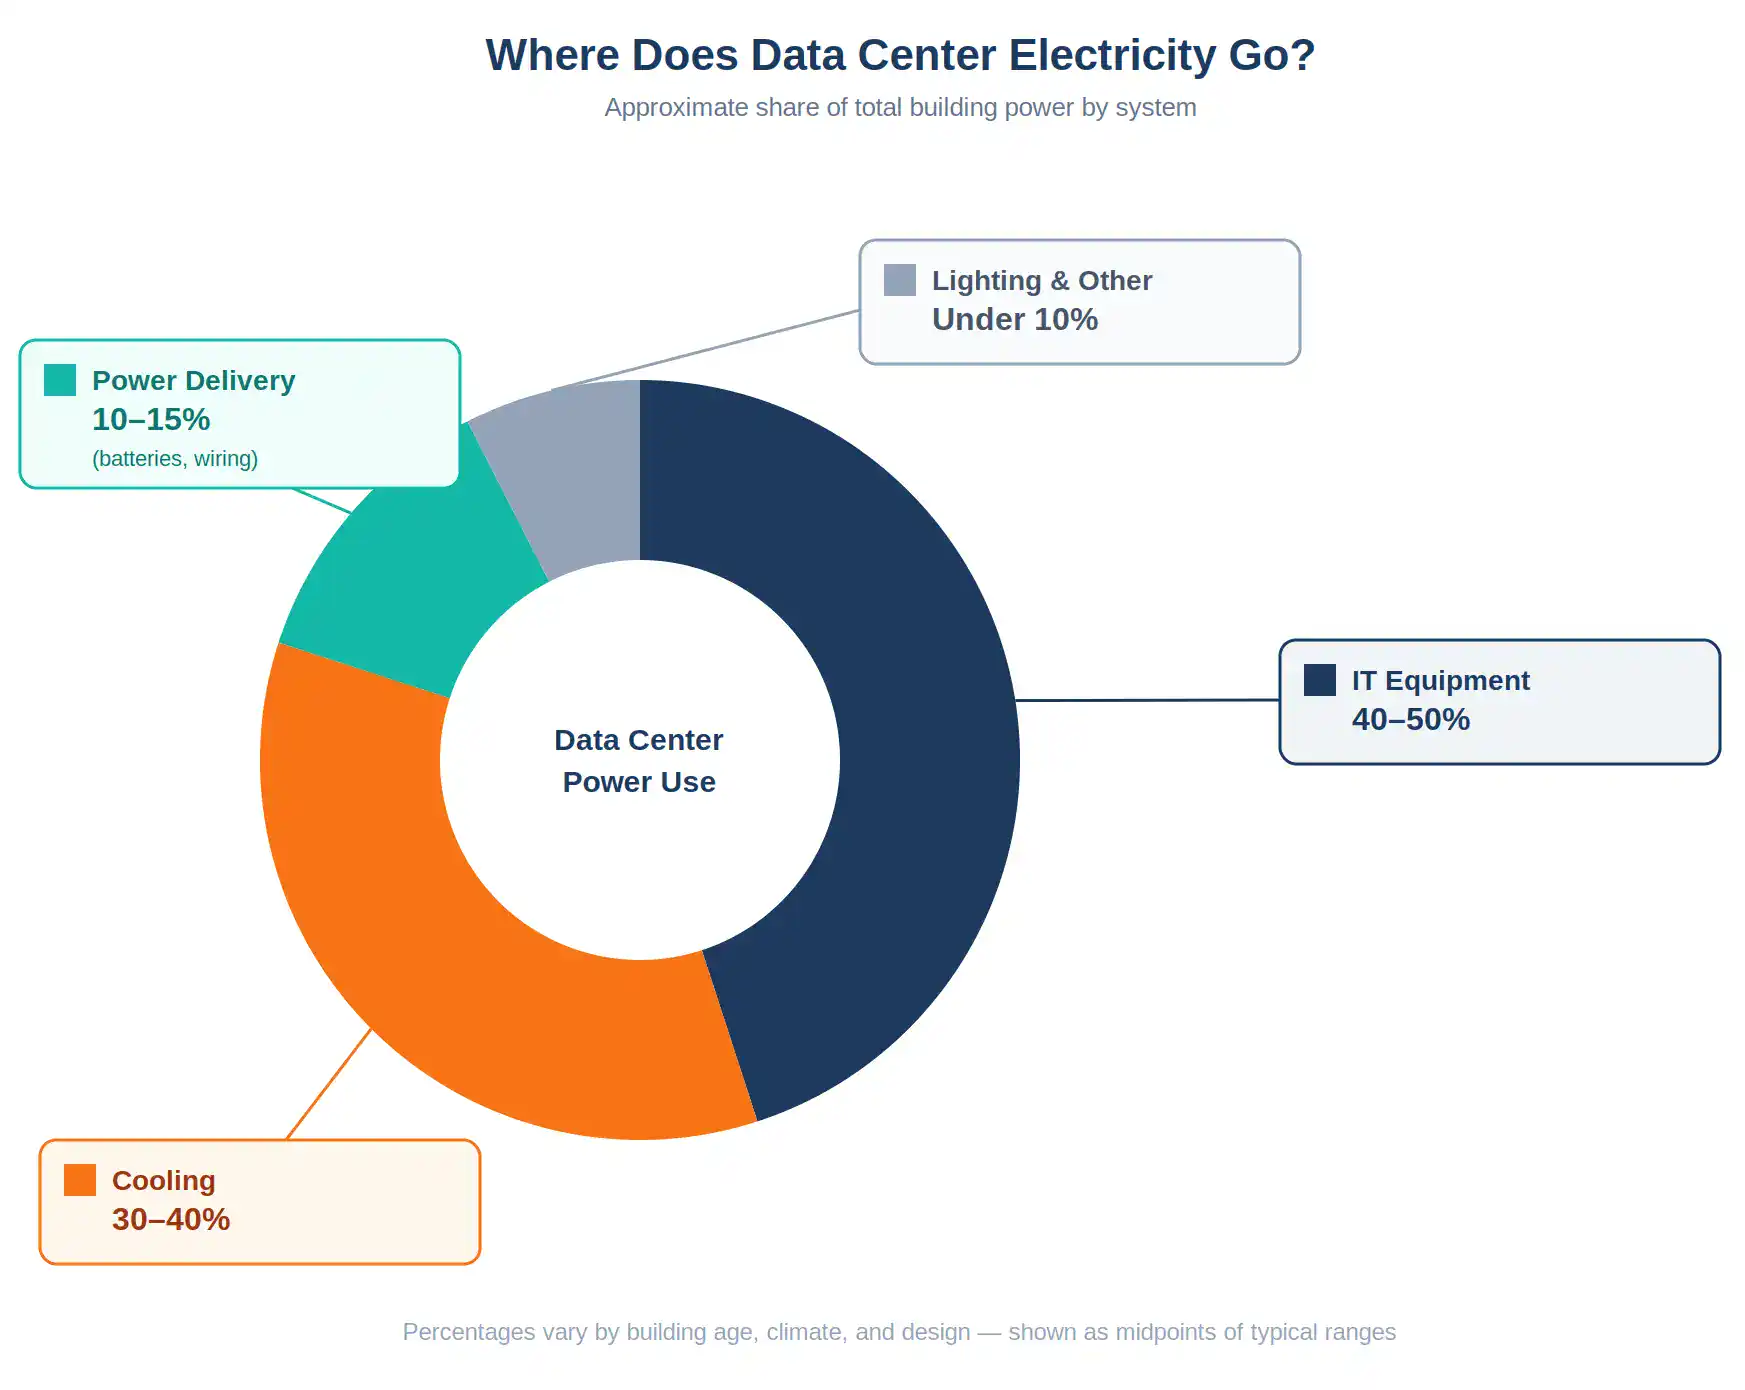
A data center is not just a room full of computers. Several different parts of the building use power at the same time, and a good estimate has to count every one of them.
The computers themselves (servers, storage drives, and network gear) use the biggest chunk of power, usually somewhere around 40 to 50%.
Cooling is the second-biggest user, often 30 to 40%. Every watt a server uses turns into heat, and that heat has to go somewhere.
Power delivery equipment, like backup batteries and the wiring between them, usually uses another 10 to 15%. Power gets lost a little bit every time it changes form on its way to the computer.
Lights and other building systems make up the rest, usually under 10%.
Step 1: Calculate the Actual IT Load
Why Nameplate Power Ratings Can Be Misleading
Every server comes with a sticker called a nameplate rating. It lists the highest possible power the machine could ever use under the worst conditions.
Think of it like the “max speed” printed on a treadmill. You’ll almost never actually run that fast, but the machine has to be built to handle it just in case. Nameplate numbers are almost always much higher than what a server really uses.
A 2003 study from Lawrence Berkeley National Laboratory looked at real data center equipment and found that actual power use was usually only about 30% of the nameplate number.
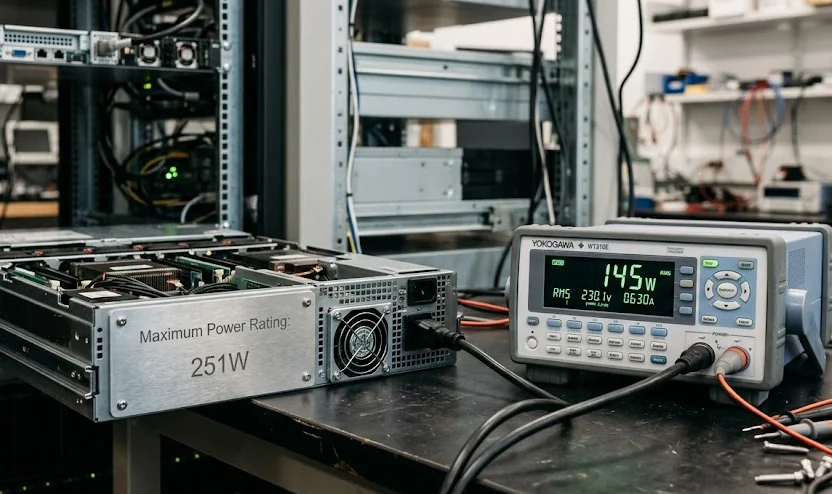
A famous research paper from Google found something similar with one specific server. Its nameplate said 251 watts. But even under the heaviest test they could run, it only used 145 watts, less than 60% of what the label claimed.
If engineers built a power system using nameplate numbers, they would build something way bigger, and way more expensive, than the building actually needs.
How Engineers Estimate Real Server Power Usage
Most server companies offer online tools where you type in the exact parts you’re using (which chip, how much memory, how many drives) and get back a realistic power number for that exact setup. This beats guessing from the nameplate by a lot.
If a company already runs a similar data center, engineers can pull real numbers straight from smart power meters and battery backup systems. The same Google research paper found that once a model is checked against real measurements like this, it can be accurate to within 1%.
Engineers also build in how busy the computers actually are. Most servers aren’t running at full power all day, so a smart estimate uses an average load instead of treating every hour like the busiest hour.
Network equipment is easier to estimate. Switches barely change how much power they use no matter how busy they are, under 2% difference from idle to fully busy, so engineers just count up the switches and apply one flat number per switch.
Design Power vs Actual Power Consumption
There’s one more wrinkle engineers have to keep in mind: the difference between design power and everyday power.
Design power is the biggest possible load the electrical system has to be built to handle, even if that moment almost never happens. Everyday power, sometimes called average operating power, is what the building actually pulls most of the time.
Think of it like a family car. It might be built to handle five passengers and a full trunk on a steep hill (that’s the design case), but on a normal Tuesday it’s usually just carrying one person to work (that’s the everyday case).
You still have to build the engine for the hard day, even though most days are easy.
Engineers size the wires, breakers, and backup batteries around the design power, the worst-case number, because the building has to survive that moment without failing. But they estimate the electricity bill around the everyday power, since that’s what the meter actually counts most of the time.
Mixing these two numbers up is one of the easiest ways to get an estimate wrong.
Step 2: Calculate Total Power Using PUE
Once engineers know the real IT load, they need to know how much total power the whole building needs to support it. That’s what PUE measures.
PUE stands for Power Usage Effectiveness. An industry group called The Green Grid created it in 2007, and it quickly became the standard way to talk about how efficient a data center is.
PUE = Total Building Power ÷ Computer Power
A PUE of 1.0 would mean every single watt goes straight into computing, which isn’t actually possible in real life. A PUE of 2.0 means half the power is going to things other than computing. A PUE of 1.2 means only 20% goes to overhead, which is excellent.
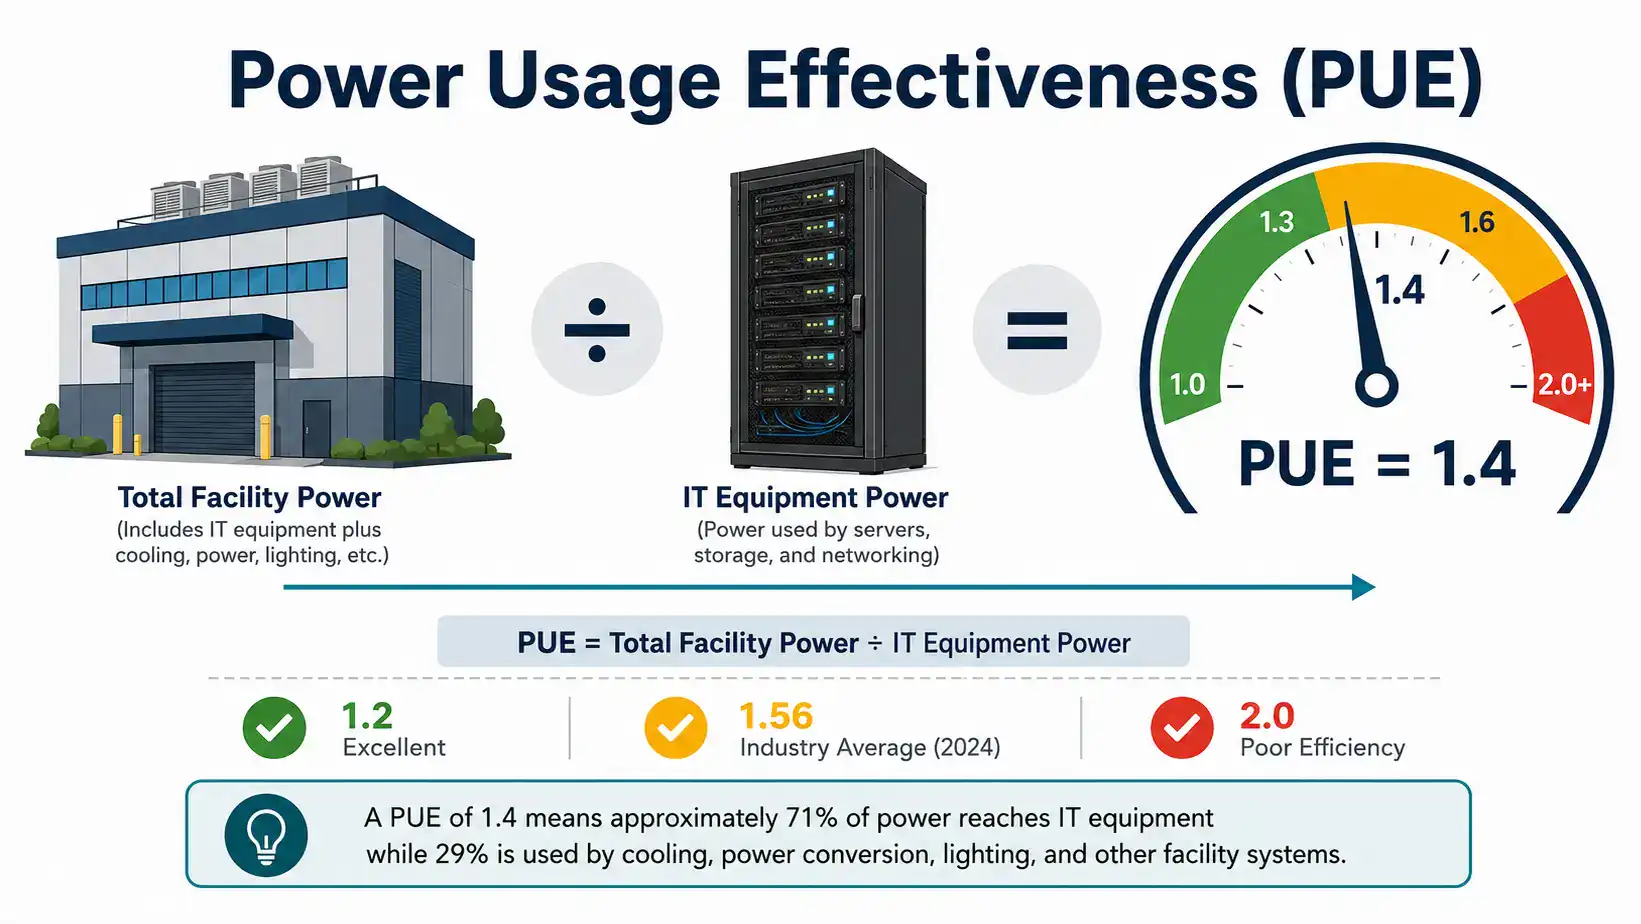
The industry has gotten a lot better at this over time. According to the Uptime Institute’s yearly survey, the average PUE worldwide was about 2.5 back in 2007. It dropped fast through the early 2010s, then leveled off.
It sat around 1.55 in 2022 and was 1.56 in the newest 2024 survey. Progress has slowed because the easy fixes have already been made almost everywhere, and a lot of older buildings are still dragging the average up.
Location matters a lot too. Uptime’s data shows North America and Europe averaging around 1.5, while hot regions like the Middle East, Africa, and Latin America often sit above 1.7, simply because the cooling systems there have to work much harder.
How to Calculate Data Center Power Requirements
Say your computers need 10 megawatts of power, and you’re aiming for a good PUE of 1.4:
10 MW (computer power) × 1.4 (PUE) = 14 MW (total building power)
That extra 4 MW goes to cooling, power conversion, and everything else that keeps the building running.
Engineers also use a more specific version called pPUE (partial PUE), which looks at just one part of the building, like only the cooling system, instead of the whole thing. This helps them find exactly where the waste is hiding.
What Is Stranded Capacity in a Data Center?
Here’s something that surprises a lot of people: a data center can have plenty of power capacity on paper and still run out of usable power.
Power gets handed out to the building in fixed-size chunks, like one chunk per row of racks or one chunk per electrical panel. If a row of racks only needs 80% of the power chunk it was given, that leftover 20% usually can’t be sent over to help a different row that’s running short.
It just sits there unused. Engineers call this stranded capacity.
It’s a bit like splitting a pizza into eight equal slices for eight people, but one person isn’t hungry. You can’t easily reshape that leftover slice into a sliver for everyone else, it’s already cut. The data center paid for that slice of power capacity either way.
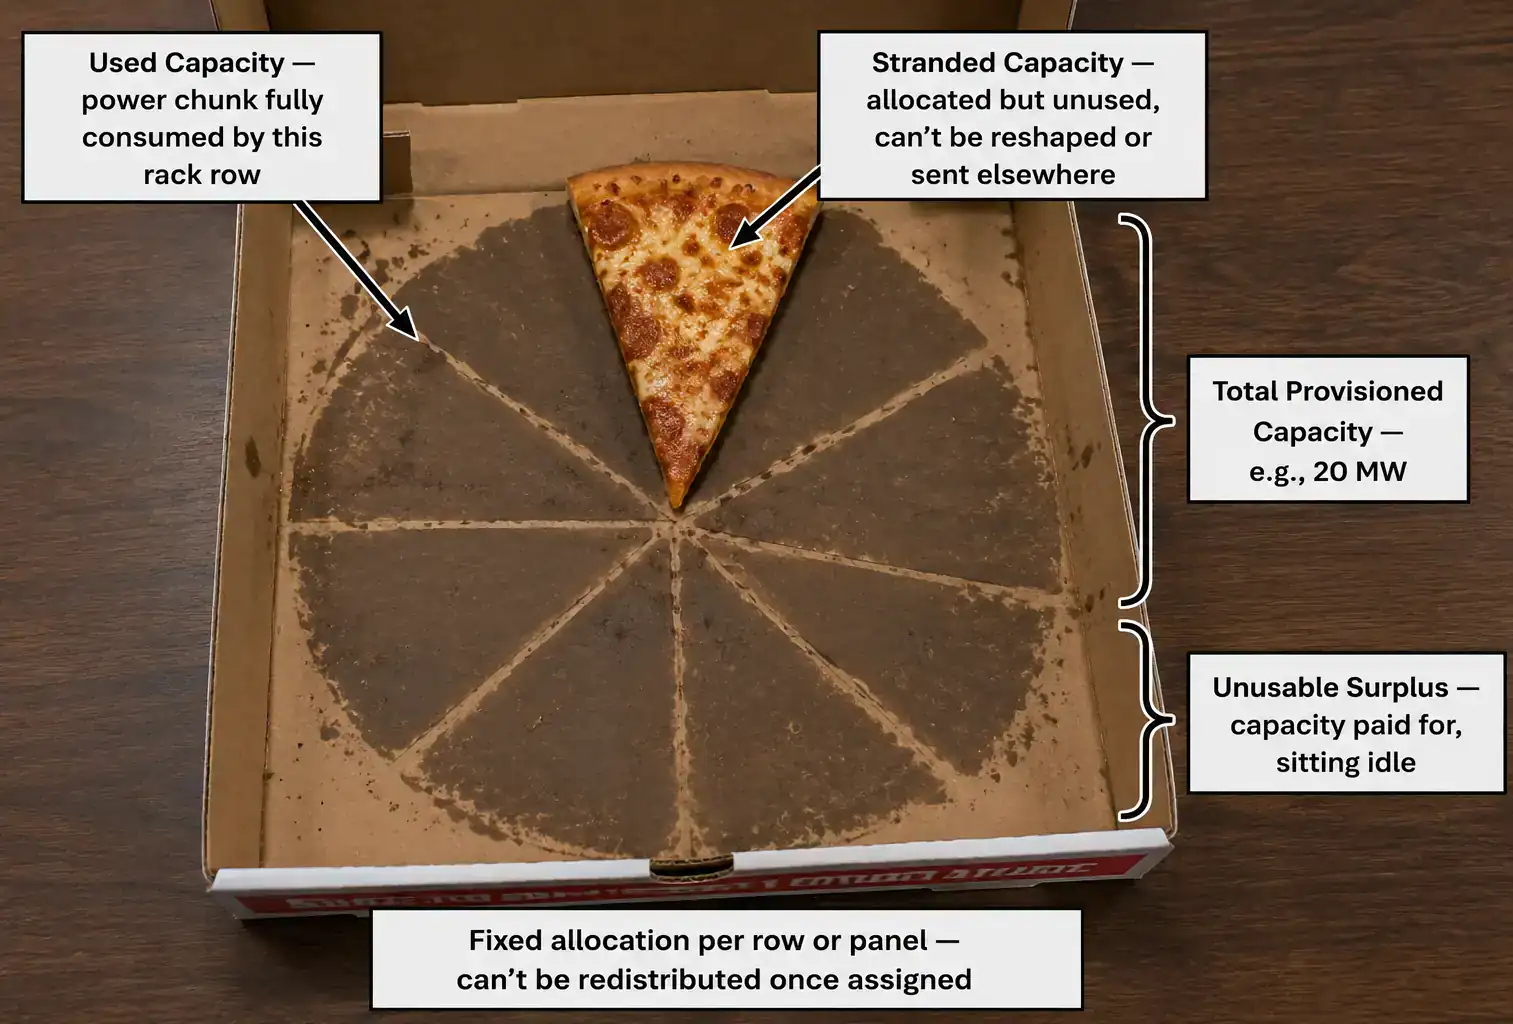
This is one of the trickiest parts of real-world data center planning. A building might show 20 MW of total capacity on paper, but because of how that power gets divided up between rows and racks, the usable amount might be noticeably lower. Good engineers plan around this instead of being surprised by it later.
Step 3: Estimate Cooling Power Requirements
Cooling is where the engineering gets genuinely tricky, because the cooling system has to remove heat from more than just the computers.
The computers are the biggest source of heat. Almost every watt they use eventually turns into heat. Backup batteries and power distribution equipment add more heat too, since even efficient equipment wastes a little power as heat while it works.
Lights add a small amount. So do people: every person working inside a data center adds about 100 watts of body heat to the room, roughly the same as a bright light bulb.
But cooling isn’t only about temperature. It’s also about humidity, how much moisture is in the air. Air conditioning systems don’t just cool air, they also pull moisture out of it, and removing that moisture takes extra energy on top of the energy used to cool the air itself.
Engineers call the heat from temperature “sensible heat” and the energy spent removing moisture “latent heat.” If the air gets too damp, water can condense on equipment and cause damage. If it gets too dry, static electricity becomes a real risk.
So cooling systems have to balance both jobs at once, not just chase a single temperature number.
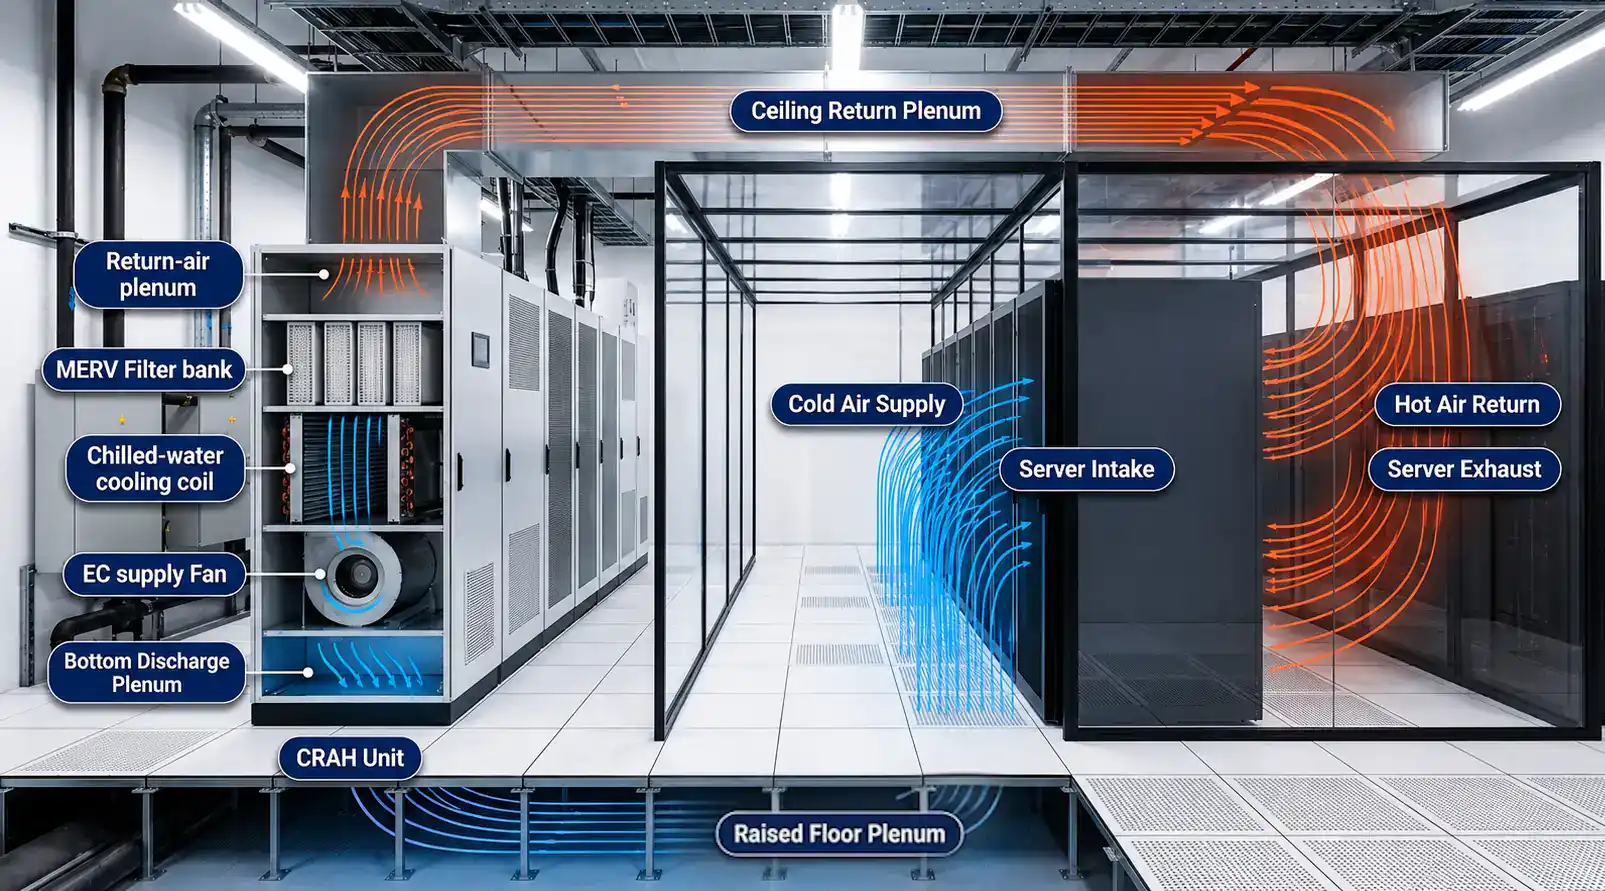
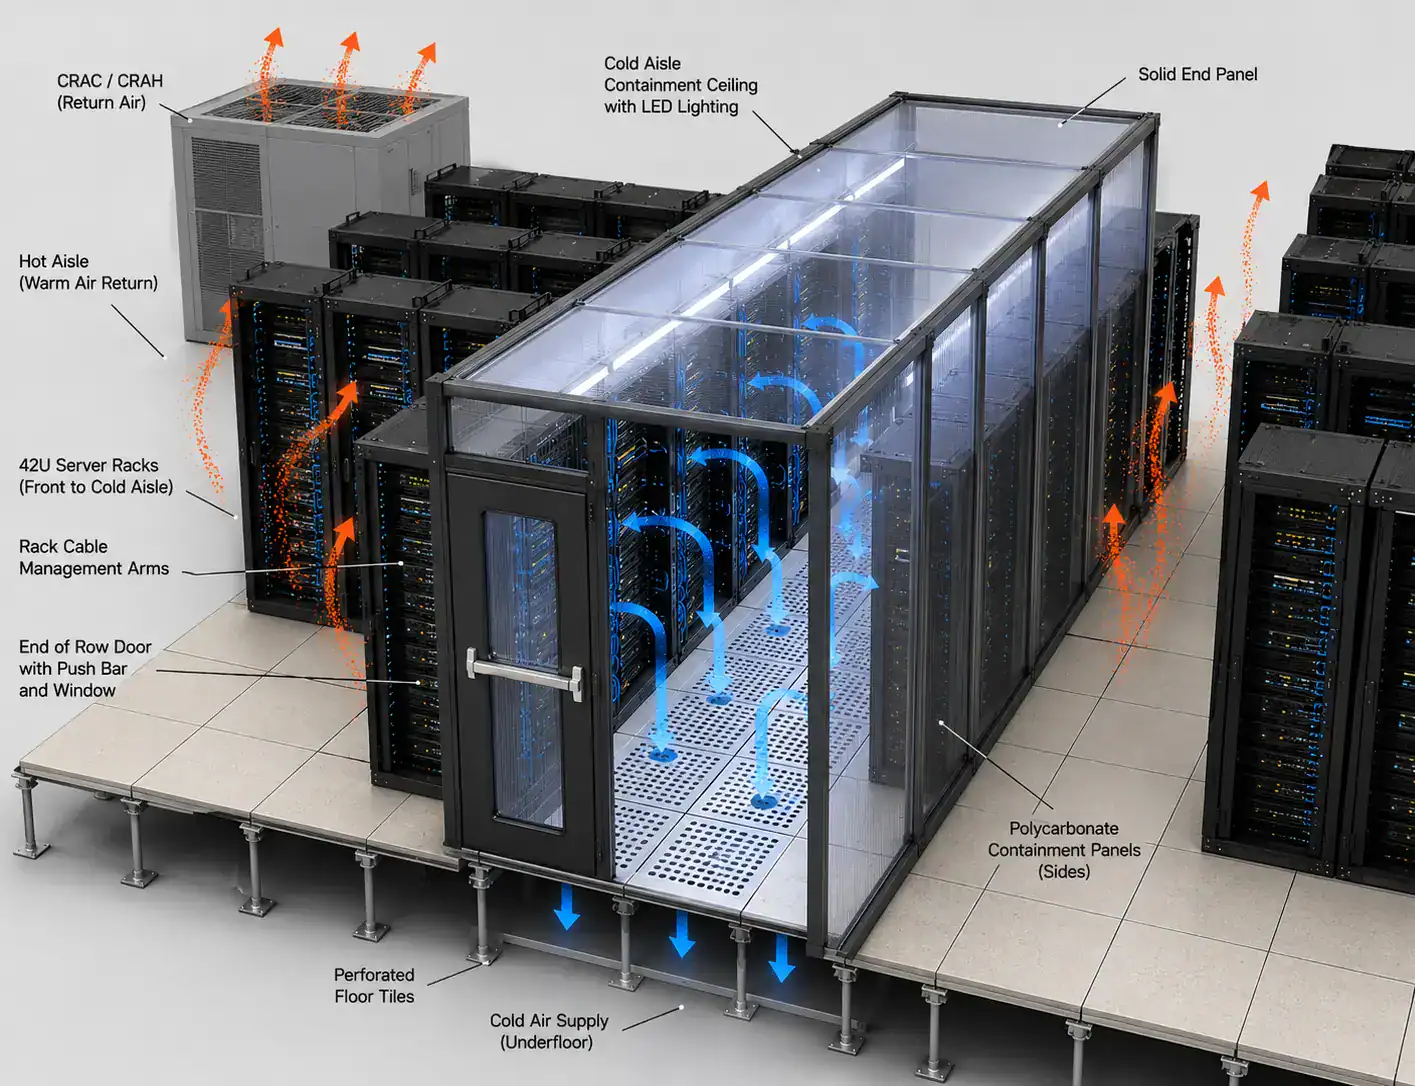
Once every heat source is added up, the cooling system has to remove all of it, plus cover its own internal losses. In older buildings with poor airflow design, cooling alone can use up to 50% of total power.
In a modern building with smart airflow design (keeping hot air and cold air separated, often called hot-aisle/cold-aisle containment), that can drop to 15 to 25%.
Step 4: Include Power Distribution and UPS Losses
Electricity doesn’t travel from the power line to a computer chip for free. Every time it changes form along the way, a little bit gets lost as heat. Here’s roughly what that journey looks like:
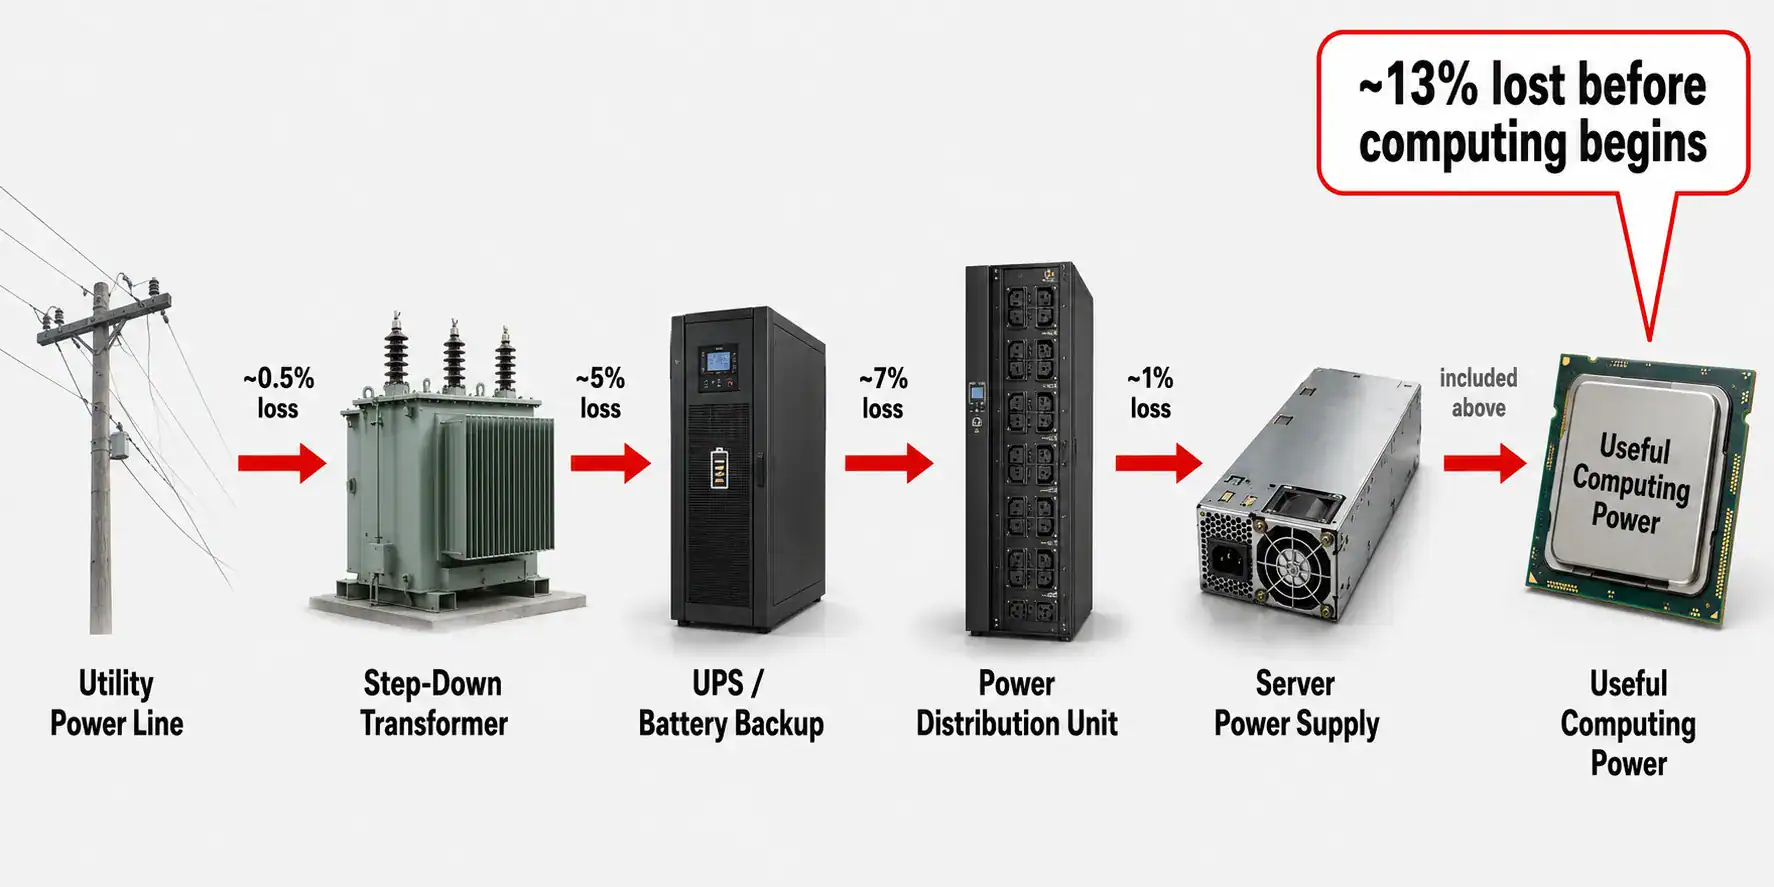
- Power enters the building from the utility company (a small loss here too, around 0.5%)
- A transformer steps the voltage down to a usable level (around 5% loss)
- Backup battery systems clean up the power and keep it steady during outages (around 7% loss)
- Power distribution equipment spreads the electricity out to each rack (around 1% loss)
- Each server’s own internal power supply converts the electricity one last time for its chips (more loss here too, depending on the hardware)
Add it all up, and a well-studied model of this whole chain found it loses about 13% of the IT load before a single cooling fan even turns on.
There’s also a piece of equipment missing from that list that engineers always plan for: backup generators. If the power from the utility company cuts out, generators (usually running on diesel or natural gas) kick in to keep the building running until the power comes back.
Generators aren’t usually running, so they don’t add to everyday power loss. But engineers still have to size them, fuel them, and test them regularly, and they take up real space and budget in the overall power plan.
What Is Power Factor and Why Does It Matter?
There’s one more idea that trips up a lot of people, even some engineers early in their careers: power factor.
Not all electricity that flows through a wire actually does useful work. Some of it sloshes back and forth without ever turning into computing power, kind of like revving a car engine in neutral. You’re burning fuel and making noise, but the car isn’t actually moving forward.
Power factor measures how much of the electricity flowing through the system is actually “moving the car forward” versus just sloshing back and forth uselessly.
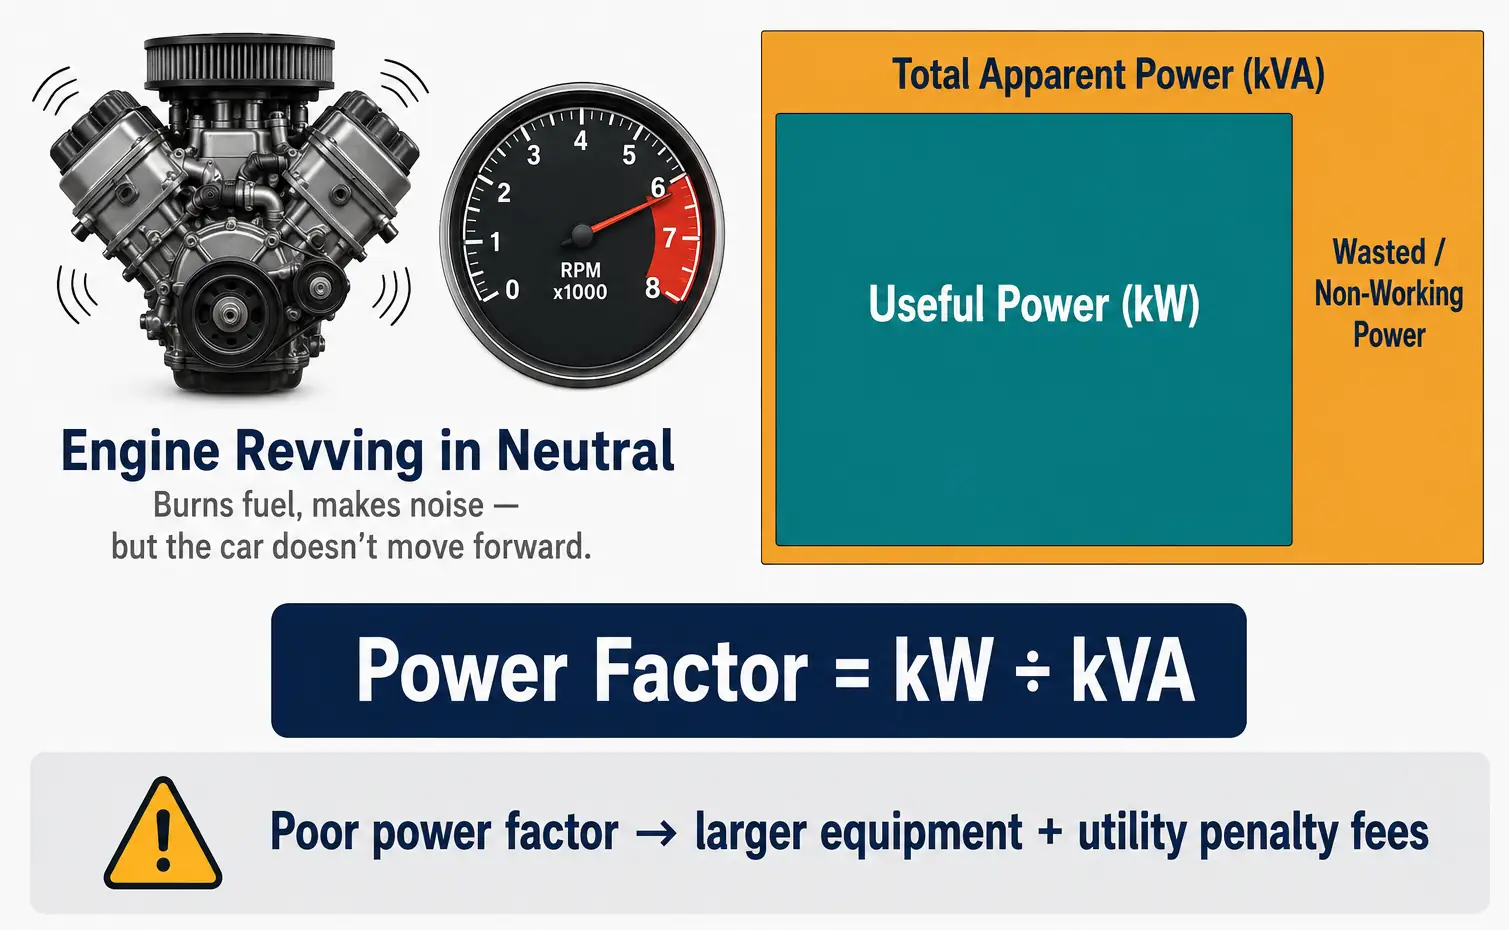
This matters because electrical equipment like transformers and backup batteries has to be sized for the total amount of electricity flowing through it, even the wasted part, not just the useful part. Engineers measure this total amount in kVA (kilovolt-amps) instead of kW (kilowatts).
If the power factor is poor, you need bigger, more expensive equipment to deliver the same amount of useful computing power. Many electric utility companies even charge extra fees to customers with a poor power factor, since it forces the utility’s own equipment to work harder too.
This is a real, everyday cost in data center planning that often gets left out of simple explanations of how power gets estimated.
How AI Is Changing Data Center Power Requirements
Everything above has been true for decades. AI changed it fast.
A normal server rack uses 5 to 15 kW. A rack packed with AI chips now routinely uses 30 to 100+ kW.
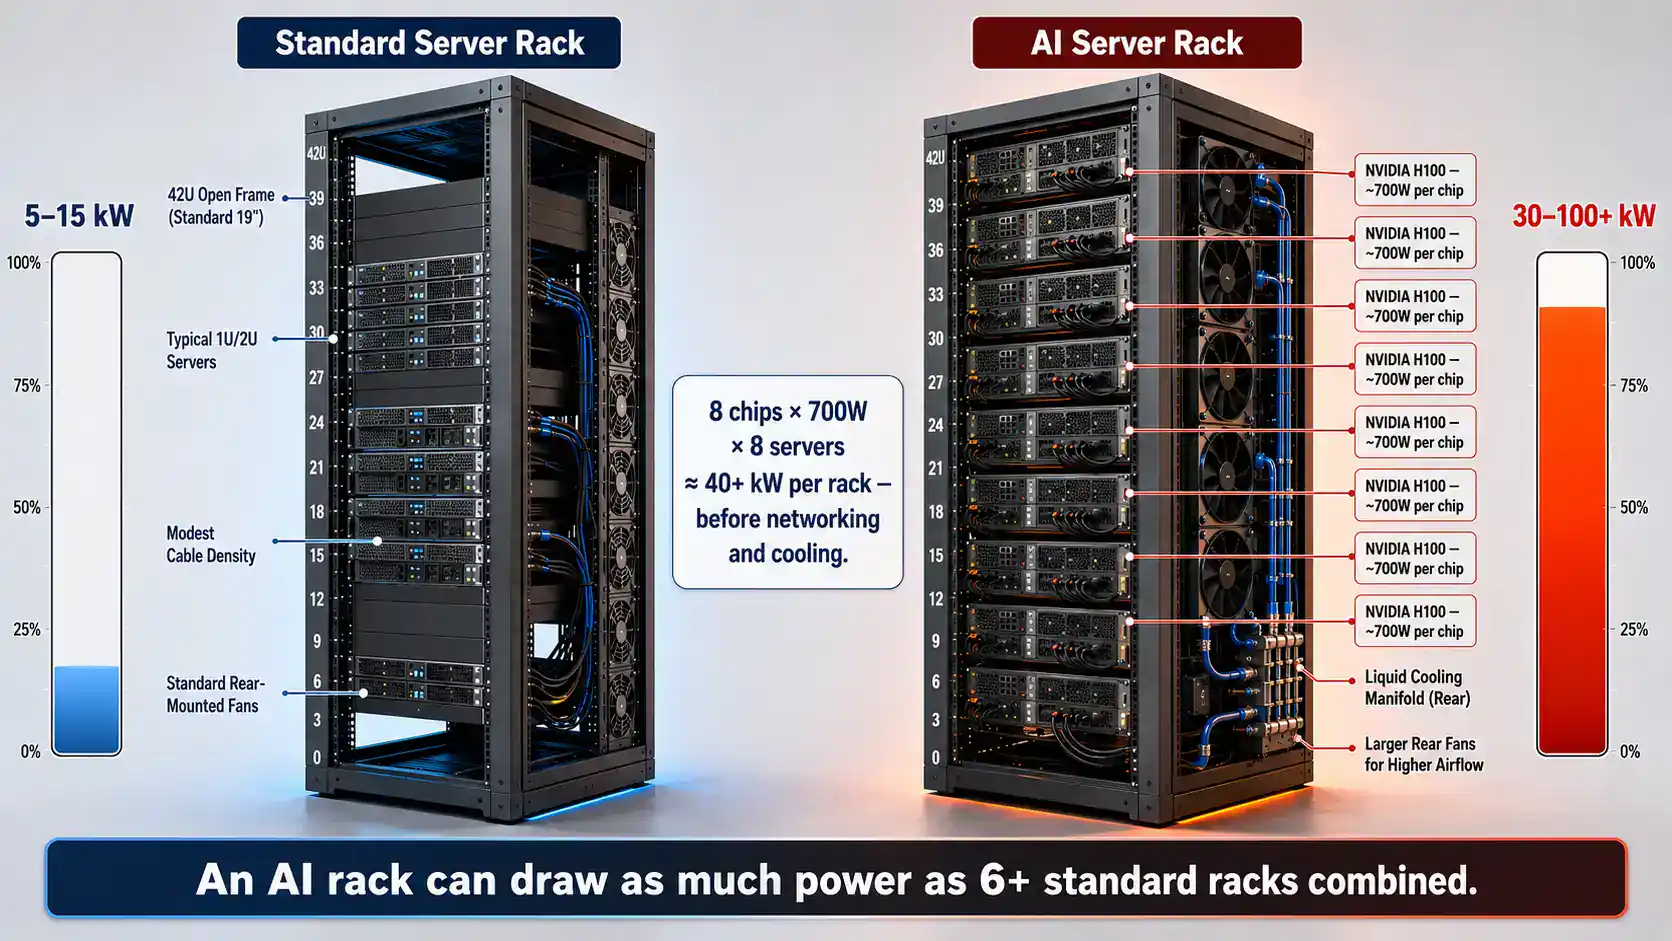
The reason is simple: a single NVIDIA H100 chip, a popular AI chip, has a rated power use of about 700 watts all by itself. Pack a rack with eight servers that each hold 8 of these chips, and you’re already past 40 kW before you’ve even counted the networking gear.
This is also where old rules of thumb stop working. Epoch AI, a research group that closely studies AI infrastructure, found in a December 2025 study that the AI chips themselves only make up about 40% of the total power used in a modern AI data center. The rest goes to everything around them: other chips, memory, networking, cooling, and conversion losses.
Their published numbers back this up with two useful multipliers. Going from a chip’s rated power up to the power of the whole server it sits inside (other chips, memory, fans, and storage included) adds roughly 1.82 times more, based on real specifications from NVIDIA’s own servers.
Going all the way from chip power up to the total power pulled from the electrical grid (counting networking, cooling, and power conversion too) adds roughly 2.5 times more, according to Epoch’s newest modeling. So a room full of chips rated at 1 MW realistically pulls something closer to 2.5 MW from the grid.
Interestingly, the same research found that AI-focused data centers can actually reach a lower PUE than the industry average, around 1.14, compared to the broader US average of 1.43, because they’re new buildings designed from scratch around these dense, hot racks.
The size of AI training has exploded too. Epoch AI’s tracking shows that the power used by the biggest AI training clusters has roughly doubled every 13 months. As one example, xAI’s Colossus cluster runs at around 280 MW.
A separate study by Epoch and EPRI thinks the biggest training runs by 2030 could need 4 to 16 gigawatts, enough to rival a large power plant. Training itself isn’t cheap either: training a model like GPT-4 is estimated to have used around 50 gigawatt-hours of electricity, enough to power the entire city of San Francisco for about three days.
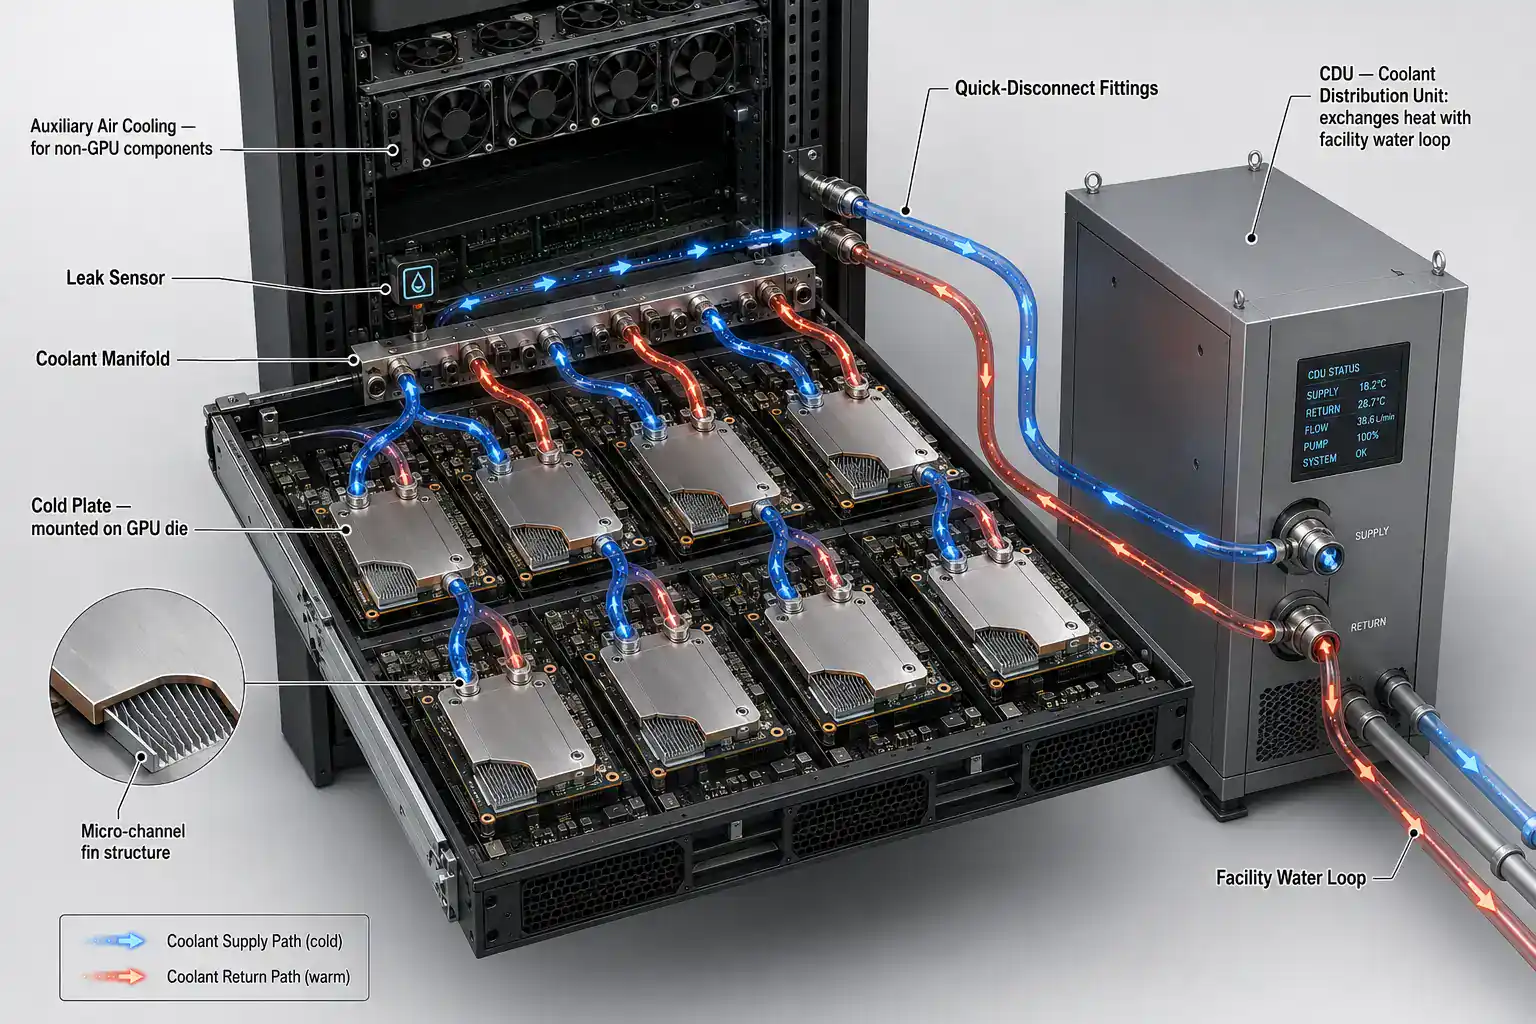
All of this means cooling has to change too. Regular air cooling often can’t keep up with 50 to 100 kW racks, which is why liquid cooling and even fully submerging hardware in special cooling fluid are now becoming normal in new AI buildings instead of rare exceptions.
Data Center Power Planning Tools Used by Engineers
Doing this math by hand is a fine starting point, but real buildings are complicated enough that engineers lean on dedicated software.
DCIM software (Data Center Infrastructure Management), like Schneider Electric’s EcoStruxure or Nlyte, pulls together live data from thousands of power meters and sensors into one screen. It calculates PUE automatically, warns engineers when efficiency drops, and lets them test “what happens if we add this rack?” before touching any real equipment.
Digital twins take this further. It’s a virtual copy of the real building, fed by live sensor data, that lets engineers test changes safely on the computer model before making them in real life.
CFD simulation (Computational Fluid Dynamics) models exactly how hot and cold air move through a room, which helps engineers spot hidden hot spots and bad airflow before they become real problems.
Specialized tools like DCSim are built just for modeling data center energy use. They account for things like how outdoor temperature changes throughout the year, and how cooling efficiency shifts depending on how busy the building is.
Data Center Power Calculation Example
Here’s how a real estimate comes together step by step, with the AI version shown alongside it.
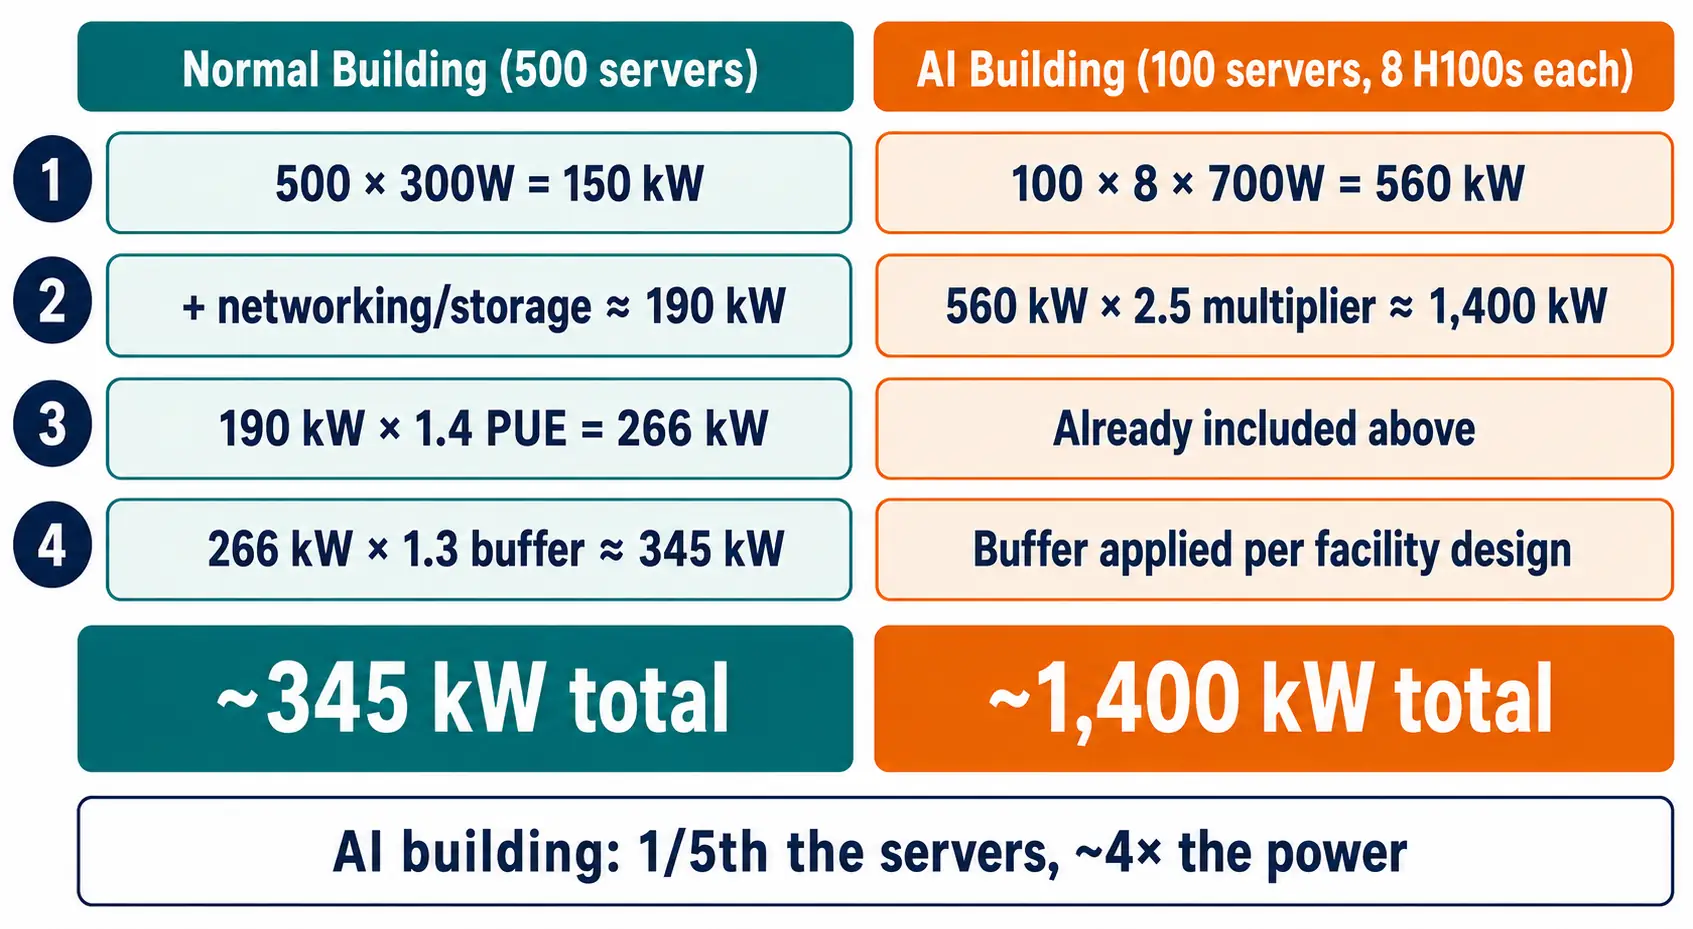
Step 1: Start with the basic computer load. 500 normal servers averaging 300 watts each gives a starting load of 150 kW. For an AI building: 100 AI servers, each holding 8 H100 chips at 700 watts each (5.6 kW per server), gives a starting AI chip load of 560 kW.
Step 2: Add networking and storage. Networking usually adds another 10 to 15%, and storage drives add another 5 to 10%, bringing the normal building to roughly 190 kW of total computer load. For the AI building, engineers often skip straight to Epoch’s chip-to-building multiplier instead: 560 kW × 2.5 ≈ 1,400 kW total building power, since that single multiplier already covers the servers, networking, cooling, and conversion losses together.
Step 3: Apply PUE. This step is for the normal building (the AI multiplier above already includes it). 190 kW × 1.4 PUE = 266 kW total building power.
Step 4: Add backup capacity. Data centers are usually built with at least one spare for every critical system (called N+1), plus another 25 to 30% of extra room for future growth. 266 kW × 1.3 = roughly 345 kW total power needed from the utility company, for the normal building.
Step 5: Sanity-check the cost. One megawatt running nonstop for a full year adds up to about 8,760 megawatt-hours. At typical commercial electricity prices, that lands somewhere between roughly $440,000 and $1.3 million per megawatt per year, depending entirely on local electricity rates.
For the 345 kW building above, that’s a rough annual electricity bill in the low hundreds of thousands of dollars, and that’s before counting cooling staff, maintenance, or the hardware itself. (Real bills are usually more complicated than this, since many utility companies also charge separate fees based on a building’s single highest moment of power use, not just its total energy over the year.)
Common Mistakes When Estimating Data Center Power Usage
Trusting nameplate ratings. As covered above, nameplate numbers can overstate real power use by 40% or more, leading straight to an oversized, overpriced design.
Ignoring how busy the computers really are. Servers rarely run flat-out all day, every day. An estimate built around peak load the whole time will overstate real demand.
Forgetting conversion losses. Backup batteries, power distribution gear, and server power supplies all lose a slice of power as heat. Skip that, and the estimate runs low.
Using a generic PUE. PUE changes a lot depending on climate and cooling design. Borrowing a generic industry-average number instead of measuring your own specific building leads to real errors.
Treating AI racks like normal racks. AI training keeps chips running near their full rated power for long stretches, which is very different from a normal server’s typical 20 to 30% usage. Reusing old assumptions here badly undercounts the real number.
Skipping backup-level definitions. N+1 means one spare for every critical system. N+2 means two spares. 2N means a fully separate, fully duplicated backup system. Each level costs real money, and it needs to be part of the budget from day one, not added later as an afterthought.
Ignoring stranded capacity and power factor. A building can look like it has plenty of spare power on paper while still running short in practice, because of how power gets divided into fixed chunks and because of how power factor affects equipment sizing. Skipping these details is one of the most common ways a “paper” estimate turns out wrong once the building is actually running.
The Future of Data Center Power Planning
Power estimation is moving toward more automation, not less. DCIM software increasingly uses machine learning to predict demand spikes before they happen, and several major cloud companies, including Google, which has promised to run on fully carbon-free energy by 2030, are now factoring in how clean the electricity is at different times of day, not just how much of it they use.
The bigger story is just how fast all of this is growing. The IEA expects global data center electricity use to climb from 415 TWh today to around 945 TWh by 2030, and toward 1,200 TWh by 2035 in its main forecast.
Whatever the exact final number turns out to be, the engineers who can accurately estimate, model, and improve that power use are going to be some of the most valuable people in the industry for years to come.
Common Questions About Data Center Power Usage
⌄
⌄
⌄
⌄
⌄
⌄
⌄
⌄
⌄
Written by
Engineering Junkies Team
We are a team of engineers, researchers and technology writers who love breaking down complex topics into clear and honest content. Every article we publish is built on real research and honest writing.
You can reach us through our Contact Us page.


